
Reports in EnrollNow allow your team to view, analyze, and track important study data. You can build reports to answer specific questions, monitor recruitment progress, review participant activity, and identify trends across your studies.
Before You Build a Report
Before creating a report, it is helpful to define what you want the report to show. Start by identifying the question your report should answer.
For example:
How many eligible participants came from each recruitment site?
Once you know the purpose of the report, you can identify the key elements needed to build it.
Key Report Elements
Most reports are built using a combination of measures, dimensions, filters, and optional time fields.
-
Measures are the values you want to count, total, or calculate.
Example: Count of participants.
-
Dimensions are the categories used to group or organize the report data.
Example: Study, Custom Variables or Recruitment data.
-
Filters narrow the report results to show only specific data.
Example: Participant Status = Eligible.
-
Time fields allow you to view report results by date or trend over time.
Example: Enrollment Date grouped by month.
Tip:
The Dimensions and Filters dropdown menus are organized into sections to help you find relevant data. To narrow the list, enter a keyword in the search bar, then select the option you need.
Steps to Build a Report
Step 1: Define the Purpose of the Report
-
Decide what question your report should answer.
-
Example: How many eligible participants came from each recruitment site?
Step 2: Identify the Key Elements
-
After defining the report question, identify the measure, dimensions, and filters needed.
-
Example:
-
Measure: Count of Participants
-
Dimensions: Site, Recruitment Source
-
Filter: Participant Status = Eligible
-
-
Step 3: Create a New Report
- Navigate to the reporting area in EnrollNow by clicking the Homepage icon in upper left.
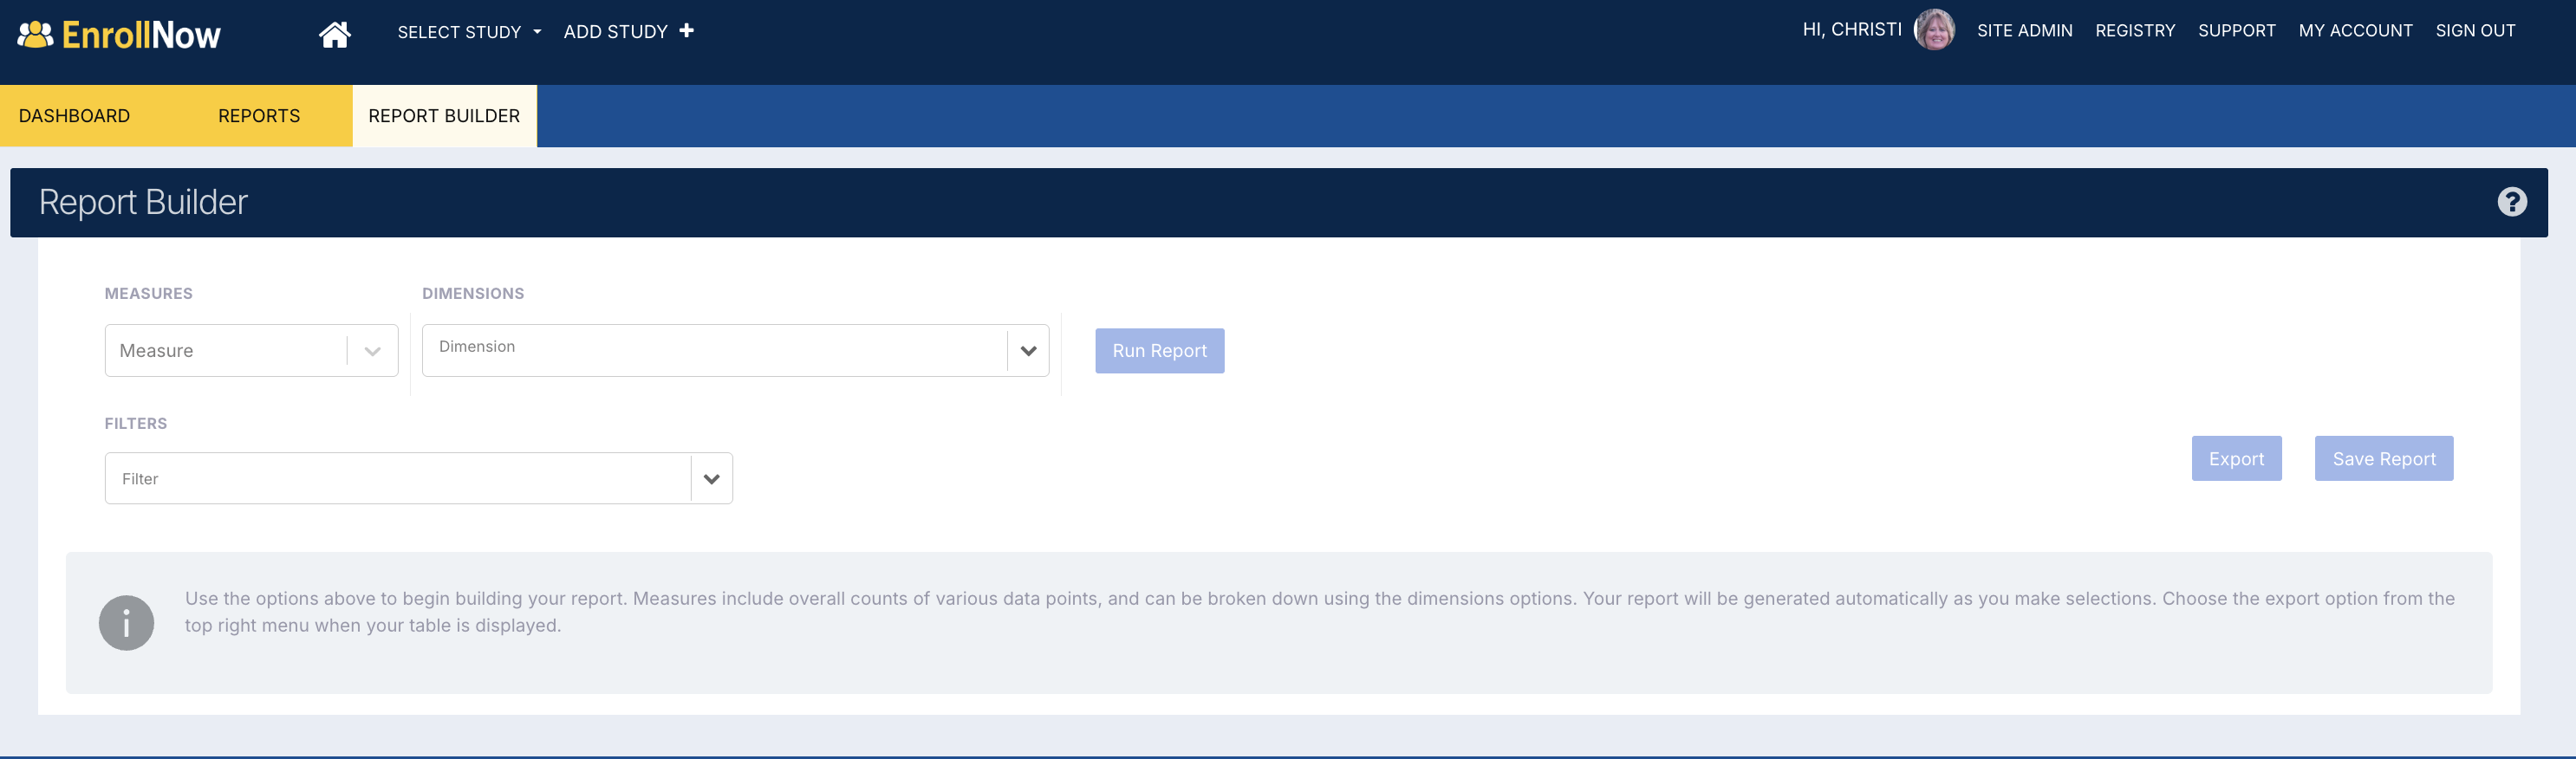
- Click Report Builder
Step 4: Add a Measure
The measure determines what the report will count or calculate.
- Click the dropdown arrow on Measures field.
- Select the measure you want to use.
-
Example:
-
Count of Participants
-
-
Step 5: Add Dimensions
Dimensions determine how the report data will be grouped.
- Click the dropdown on Dimensions field.
- Scroll to select the first dimension or type the first few characters to narrow down your list of choices.
-
-
Example:
- Recruitment Site
-
- Click the dropdown again to add other dimensions, if needed.
-
Example:
-
Recruitment Source
-
-
Step 6: Apply Filters
Filters allow you to narrow the report results. Filter by date or by the data in the fields chosen in the dimension field.
-
Click the dropdown on Filters field.
-
Select the field you want to filter by.
-
Choose the filter condition and value.
-
You can add more than one filter to make the report more specific.
Step 8: Run the Report
-
Click Run Report to view the report results.
-
Review the data to confirm the report is answering the intended question.
Step 9: Refine the Report
-
After running the report, you may need to adjust the measures, dimensions, filters or sorting.
-
After making changes, click Run Report again to refresh the results.
Step 10: Save the Report
-
Once the report is displaying the information you need, save it for future use.
-
Click Save Report.
-
Enter a clear report name and description.
-
Share with other on your team.
-
-
Click Save Report again.
-
Use a report name that clearly explains what the report shows.
-
Example: Eligible Participants by Recruitment Site and Source
-
Updating a Saved Report
To update an existing report, open it, make your changes, and click Save Report.
Creating a Copy of a Saved Report
To create a separate version while keeping the original report unchanged:
- Click Copy to duplicate the current report configuration.
- The copy appears in the report list with a name beginning with “Copy of…”.
- Open the copy, rename it, and make any changes.
- Click Save Report to save the new version.
Copying a report is helpful when creating variations for different teams, date ranges, statuses, or studies.
Sharing a Report
Saved reports can be shared with other users who have the appropriate access and permissions in EnrollNow.
To share a report:
- Open the saved report.
- Click Save Report.
- Select the users or user groups within the "Share With" section who should have access to the report.
- Save the sharing settings.
Users must have the appropriate site, study, and reporting permissions to view the report data. If a user does not have access to the study or fields included in the report, they may not be able to view all report results.
Tips for Building Reports
-
Use a clear report name so other team members understand the purpose of the report.
-
Start with one measure and one or two dimensions, then add filters as needed.
-
Use filters to narrow the report to the most relevant participants, events, statuses, or date ranges.
-
Run the report after each major change to confirm the results are updating as expected.
-
Save a new version before making major edits to an existing report.
Common Report Examples
Race, Ethnicity, and Gender Breakdown
This report can help your team understand the demographic breakdown of participants who meet a specific status or eligibility requirement.
Measure: Count of Participants
Dimensions: Race, Ethnicity, Gender
Filter: Participant Status = Eligible
Upcoming Events That Are Not Completed
This report can help your team identify upcoming scheduled events that still need to be completed.
Measure: Count of Events
Dimension: Event Type
Filters:
Event Status = Scheduled
Event Due Date = Next 14 Days
Recruitment Source and Site Breakdown
This report can help your team understand where participants are coming from and how many participants are eligible or ineligible by site and recruitment source.
Measure: Count of Participants
Dimensions: Site, Recruitment Source
Filters: Status = Eligible and Status = Ineligible
Pivot: By Status, such as Eligible and Ineligible
Reasons for Ineligibility
This report can help your team review common reasons participants are marked ineligible.
Measure: Count of Participants
Dimension: Ineligibility Reason, such as a Custom Variable or status note
Filter: Status = Ineligible