
The EnrollNow Dashboard provides a real-time, comprehensive view of your study’s recruitment performance and participant demographics. It is designed to help your team monitor progress, evaluate recruitment efforts, and make informed, data-driven decisions to optimize enrollment.
What the Dashboard Shows
The Dashboard brings together key metrics and visualizations, allowing you to:
- Track progress toward your enrollment goals
- Evaluate the effectiveness of recruitment sources, sites, and strategies
- Monitor participant demographics
- View weekly enrollment trends
- Forecast future recruitment performance
NOTE: The Dashboard is not customizable. The information displayed is static and will always reflect participants in the Potential and Enrolled statuses for your study.
Metrics tracked on the Study Dashboard by Section
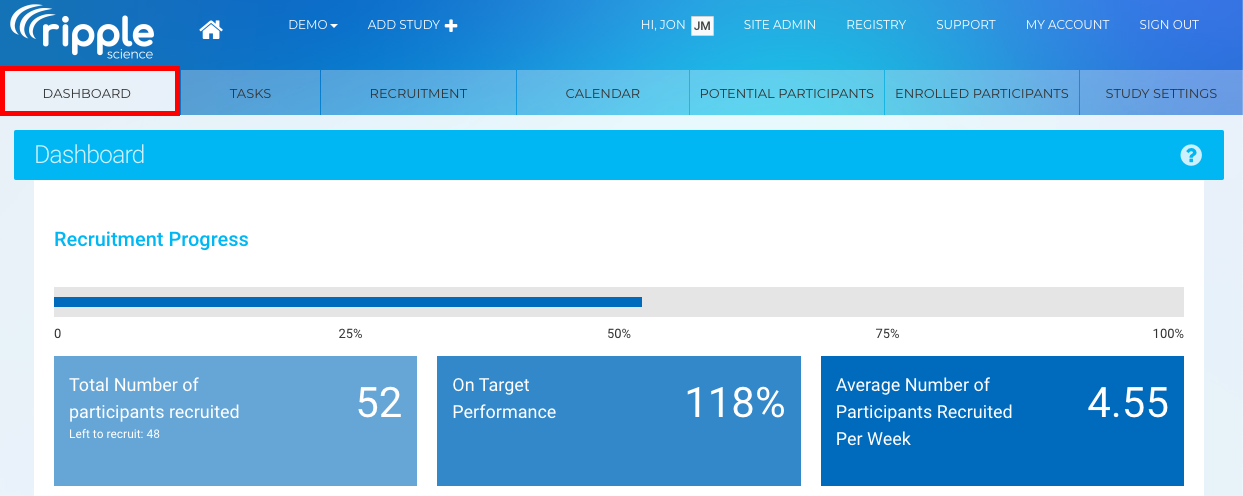
Recruitment Progress
The Recruitment Progress section provides a snapshot of how your study is performing against its enrollment goals.
Required Setup
To ensure accurate analytics, a Study Manager or Site Admin must configure on the Requirements page under Study Settings:
- Active Recruitment Start Date & End Date
- Sample Size (N) Goal for number of participants in the study
Key Metrics
- Progress Bar
Displays overall enrollment completion as a percentage-
The black line represents the number of potential participants added.
-
The yellow line shows the number of participants enrolled each week (those moved to the Enrolled Participants page).

-
- Total Participants
Shows the number of participants recruited and how many remain - Percent Completion
Indicates progress toward your enrollment goal - Average Weekly Recruitment
Calculates how many participants are enrolled per week - Weekly Recruitment Trend Chart
- Cumulative View: Total participants added over time
- Non-Cumulative View: Participants added each week
- Projected Weeks to Completion
Estimates how long it will take to reach your enrollment goal - Estimated Completion Date
Predicts when enrollment will be complete based on current trends - Projected Total Enrollment
Forecasts how many participants will be enrolled by the end date
Recruitment Performance Breakdown
These sections help you evaluate which recruitment efforts are most effective:
- Participants by Source
Bar chart showing enrolled participants by how they heard about the study- Working with Recruitment Sources article can be found here.

- Participants by Site
Bar chart showing enrolled participants by recruitment location- Working with Recruitment Sites article can be found here.

- Participants by Strategy
- Bar chart showing enrolled participants by outreach method
-
- Working with Recruitment Strategies article can be found here.

Note: These charts include participants in an Enrolled status only.
Overall Enrollment Summary
The Overall Enrollment Summary provides a high-level view of enrollment and participant distribution.
Enrollment Overview
- Donut Chart
Displays enrolled participants vs. remaining participants based on your Sample Size (N) - Status Breakdown Bar Chart
Shows counts by participant status (e.g., Potential vs. Enrolled)

Demographic Insights
The Dashboard includes bar charts showing enrolled participants by:
- Gender
- Race
- Ethnicity
- Age at Intake (age at time of study entry)
- Current Age (based on birthdate)
To ensure accurate age reporting, define Age Groups and ranges in:
Study Settings → Requirements
Viewing and Exporting Data
- Select Show Table to view detailed data behind all charts
- The table includes:
- Both Potential and Enrolled participants
- Totals across all categories

Exporting Dashboard Data
If you need to work with the data outside of EnrollNow:
-
Click Export Tabular Data as CSV.
-
The dashboard data will be downloaded into a CSV file.
-
The exported file will include all relevant statistics organized in an easy-to-read table format.
-
This is a great way to back up your dashboard insights or prepare them for external reporting.
-


Best Practices
- Complete study setup before enrolling participants
(Sample Size, recruitment dates, demographics, and metrics) - Use consistent Recruitment Sources, Sites, and Strategies
for accurate reporting - Regularly review projections and trends
to adjust recruitment efforts proactively - Leverage demographic insights
to ensure your study meets diversity and inclusion goal